Sustainability Data
Information and data on the Insource Group's sustainability initiatives are available on this page.The scope of calculation is the aggregate figures for the Company and our subsidiaries as reported in the Annual Securities Report.
Environment
CO₂ emission targt(t)
| unit | FY19(base year) | FY29(target year) | |
| Total CO₂ emissions (Scope1+2) | t | 280.2 | 140.0 |
Electricity consumption (Mwh)
| unit | FY22 | FY23 | FY24 | |
| Total power usage | thou.Kwh | 754.3 | 827.8 | 907.1 |
| Of which, percentage of renewable energy used | thou.Kwh | 6.9 | 345.1 | 675.6 |
| Renewable energy rate | % | 0.9 | 41.7 | 74.5 |
| purchased non-fossil fuel certificates | thou.Kwh | 230.0 | 0 | 0 |
| Hot/cold water | GJ | 0 | 0 | 0 |
CO₂ emission data(t-CO₂)
| unit | FY22 | FY23 | FY24 | |
| Total CO₂ emissions (Scope1+2) | t | 233.8 | 158.6 | 83.8 |
| Scope1 ※1 | t | 0 | 0 | 0 |
| Scope2 ※2 | t | 233.8 | 158.6 | 83.8 |
| Supply-chain emissions(Scope1+2+3) | t | 5,479.8 | 1,623.4 | 2,173.8 |
| Scope3 ※3 | t | 5,246.0 | 1,464.8 | 2,090.0 |
| Caluculating※4 | t | 84.6 | 91.3 | 326.1 |
※1 Since we do not have our own production facilities and do not emit carbon dioxide or other GHG resources through fuel combustion or chemical reactions, Scope 1 is set to 0.
※2 Scope2 is calculated based on market-based figures.
※3 Calculated by referring to the emissions intensity in the "Basic Guidelines on Accounting for Greenhouse Gas Emissions Throughout the Supply Chain" of the Ministry of Economy, Trade and Industry and the Ministry of the Environment of Japan.
※4 Calculated with reference to "CO₂ emissions in the life cycle of paper and paperboard" by the LCA Subcommittee of the Japan Paper Association.
Scope3 Details
Resource Recycling (t)
| unit | FY22 | FY23 | FY24 | |
| Amount of waste | t | 20.9 | 17.34 | 20.38 |
| Of which emissions recycled | t | 8.87 | 8.72 | 10.7 |
| Data coverage | % | 13.8 | 13.0 | 11.3 |
※ *Data coverage is calculated based on the number of employees currently working in offices where amount of waste is known.
Water resources (㎥)
| unit | FY22 | FY23 | FY24 | |
| Water consumption | ㎥ | 1,558 | 2,894 | 3,246 |
| Data coverage | % | 37.9 | 58.9 | 57.6 |
*Data coverage is calculated based on the number of employees currently working in offices where water usage is known.
Social
Humman Capital
General Information
| unit | FY22 | FY23 | FY24 | |
| Number of personnel | people | 647 | 684 | 755 |
| Number of employees | people | 443 | 476 | 550 |
| Number of temporary employees | people | 204 | 208 | 205 |
| Ratio of temporary employees | % | 31.5 | 30.4 | 27.1 |
| Average age of employees | year-old | 31.8 | 31.9 | 36.7 |
| Average working years of employees | year | 4.9 | 5.1 | 5.0 |
| Average annual salary | yen | 5,539,505 | 6,050,400 | 6,477,104 |
※Number of employees is the number of regular and contract employees
※Average annual salary is calculated based on the number of employees in the consolidated group. It includes bonuses and substandard wages.
New Employees
| unit | FY22 | FY23 | FY24 | |
| New employees (number of employees hired within 1 year) | people | 114 | 133 | 157 |
| Percentage of total employees | % | 17.6 | 19.4 | 20.8 |
| Percentage of new female employees | % | 55.3 | 54.9 | 50.3 |
*Number of employees: the number of full-time and contract employees
Productivity
| unit | FY22 | FY23 | FY24 | |
| Sales per Employee | thou. yen | 25,225 | 27,148 | 28,286 |
| Operating profit per employee | thou. yen | 9,220 | 10,661 | 11,654 |
Management participation
| unit | FY22 | FY23 | FY24 | |
| Percentage of the company's shares held by employees | % | 60.3 | 59.5 | 49.1 |
| Percentage of women in management positions | % | 37.4 | 40.3 | 39.9 |
| Percentage of women promoted to management positions | % | 48.3 | 56.0 | 38.1 |
※Percentage of the company's shares held by employees: Total number of employees participating in employee stock plans and holding RS (restricted stock awards).
※Percentage of women promoted to management positions: Number of women promoted from non-managerial positions to managerial positions during the period.
Ability to Take on Challenges
| unit | FY22 | FY23 | FY24 | |
| Average point of "Energy" * | point | 3.24 | 3.26 | 3.27 |
※ "Energy" is the ability to have a strong will and to find value in continuing to work despite difficulties. Maximum 5 points. Calculated using the "giraffe" characteristic assessment of our service.
HR Development
| unit | FY22 | FY23 | FY24 | |
| Training cost per employee | yen | 27,213 | 27,864 | 60,226 |
| Training hours per employee | hours | 22hrs 30mins | 28hrs 30mins | 24hrs 51mins |
| Total no. of DX training attendees | people | 248 | 1,064 | 60 |
| Compliance training attendance rate | % | 100 | 100 | 100 |
| Percentage of employees with Insource's service experience | % | 100 | 100 | 100 |
※Percentage of employees with Insource's service experience: Calculated based on use of Leaf and attendance at Open Seminars and e-Learning
Diversity
| unit | FY22 | FY23 | FY24 | |
| Ratio of female executives | % | 27.3 | 36.4 | 16.7 |
| Ratio of female managers | % | 37.8 | 40.3 | 39.9 |
| Percentage of female junior managers | % | 45.3 | 44.2 | 50.6 |
| Percentage of female managers profitable departments | % | 42.9 | 40.0 | 37.1 |
| Percentage of women in management positions | % | 48.3 | 56.0 | 38.1 |
| Ratio of female employees | % | 56.4 | 57.0 | 55.6 |
| Percentage of women in STEM (science, technology, engineering, and mathematics) professions | % | 43.7 | 48.9 | 46.7 |
| Ratio of employees with disabilities | % | 2.79 | 3.08 | 2.89 |
| Number of seniors (over 60 years old) | people | 49 | 55 | 64 |
| Number of LGBTQ+ | people | 5 | 5 | 4 |
| Number of foreign-born people | people | 4 | 9 | 5 |
※Number of employees who have agreed to be externally identified as LGBTQ+.
※Foreign-born means those who have foreign nationality. Foreign nationals include Japanese nationals from foreign countries.
Childcare leave
| unit | FY22 | FY23 | FY24 | |
| Number of childcare leave takers | people | 18 | 19 | 15 |
| Total childcare leave acquisition rate | % | 90.0 | 70.4 | 83.3 |
| Number of childcare leave takers (female) | people | 6 | 10 | 10 |
| Childcare leave acquisition rate (female) | % | 100 | 100 | 100 |
| Number of childcare leave takers (male) | people | 12 | 9 | 5 |
| Childcare leave acquisition rate (male) | % | 86.0 | 52.9 | 62.5 |
Initiatives for Health and Productivity Management
Health Issues and Targets
| Classification | Item | Unit | FY22 | FY23 | FY24 | FY24 Target |
| Medical checkups and examination | Consultation rate for regular medical checkups | % | 100 | 100 | 100 | 100 |
| Secondary medical checkup uptake | % | ‐ | 77.3 | 33.6 | 100 | |
| Percentage applicable to specific health guidance | % | 22.7 | 19.3 | 17.6 | 20.0 | |
| Lifestyle habits | Smoking rate over 40 years old *1 | % | 14.8 | 13.4 | 10.3 | 5.0 |
| Percentage of people aged 40 or older with exercise habits | % | 17.4 | 22.5 | 30.4 | 19.0 | |
| Ratio of people maintaining an appropriate weight *1 | % | 63.8 | 64.2 | 68.5 | 67.0 | |
| Mental health | Stress check uptake rate | % | 87.6 | 96.7 | 97.7 | 100 |
| Percentage of employees with high stress levels | % | 11.9 | 11.6 | 10.3 | 10.0 | |
| Labor productivity | Absenteeism *2 | Day | 3.3 | 2.8 | 3.2 | 3.0 |
| Presenteeism *3 | % | 81.9 | 82.1 | 85.0 | 85.0 | |
| Work engagement *4 | Point | 3.3 | 3.5 | 3.7 | 3.5 | |
| Work engagement response rate *5 | % | 85.2 | 94.0 | 77.4 | 100 |
*1 Persons with a BMI of 18.5 to less than 25
*2 Percentage of employees who have submitted a leave of absence report among all employees.
*3 Deviation values measured by an original questionnaire using the SPQ (Single-Item Presenteeism Questionnaire, University of Tokyo, 1-item version).
*4 Deviation measured by an original questionnaire using the shortened 3-item version of the Utrecht Work Engagement Scale
*5 Figures up to FY21 are calculated on a non-consolidated basis for Insource Co., Ltd..
*6 The period for each fiscal year is from April of the current year to March of the following year (the calculation period for the fiscal year of the Health and Productivity Survey Sheet).
Governance
Corporate Governance Structure
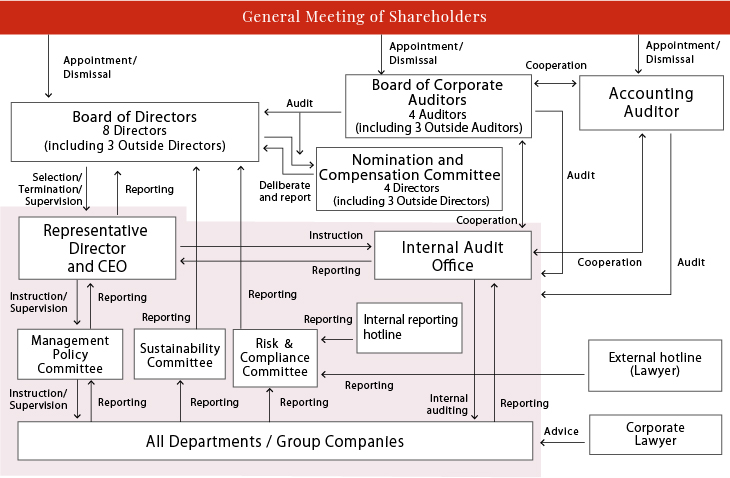
Corporate Governance Structure(FY23)
| Name | No. of members | Details | No. of meetings held |
| Board of Directors | ・Chair: Takayuki Funahashi Representative Director, President and CEO ・Members: Directors 8, including 3 Outside Directors, including 2 female Directors |
As a management decision-making body, the Board of Directors makes resolutions on important matters in accordance with the Board of Directors Regulations and Rules on Administrative Authority, and outside directors provide advice and supervision to the Board of Directors from an outside third-party perspective. In addition to regular monthly Board of Directors meetings, extraordinary Board of Directors meetings are held as necessary. | Number of times: 17 Members' attendance rate: 100% |
| Board of Corporate Auditors | ・4 Auditors, including 3 Outside Auditors, including 1 full-time Auditor, including 1 female Auditor |
In addition to regular monthly meetings, the Board of Corporate Auditors holds extraordinary meetings as necessary to review the status of audits and audit results, and to share information among the corporate auditors. Efforts are made to conduct effective monitoring by exercising legal authority, such as attending important meetings and receiving reports from related parties, as well as by conducting on-site inspections at branch offices and other locations. | Number of times: 16 times Auditor attendance rate: 100 |
| Nomination and Compensation Committee | ・Chair: Outside Director Hidenori Fujioka ・Members: 4 Directors including 3 Outside Directors including 2 female Directors |
The Committee, an advisory body to the Board of Directors, is responsible for deliberating the selection and dismissal of directors and executive officers of the Company and its group companies, as well as their compensation and succession plans, from an objective and fair perspective. | Number of times: 6 Members' attendance rate: 100% |
| Risk and Compliance Committee | ・Chair: Representative Director, President and CEO, Takayuki Funahashi |
For risk management and compliance promotion, the committee is chaired by the Representative Director and implemented by directors, corporate auditors and persons appointed by the chair. | Number of times: 4 Members' attendance rate: 100% |
| Sustainability Committee | ・Chair: Kumiko Kawabata Director, Managing Executive Officer |
The committee meets once a quarter to further promote sustainability, contribute to society and the global environment, and enhance corporate value over the medium to long term. The committee selects themes for sustainability-related activities, sets targets, confirms the progress of "task forces," which are cross-departmental teams under the committee, and promotes the disclosure of sustainability-related information. | Number of times: 5 Members' attendance rate: 100% |
| Health Management Promotion Committee | ・Chair: Kumiko Kawabata Director, Managing Executive Officer |
In order to maintain and improve the physical and mental health of employees, the Health Promotion Department, which belongs to the Group Human Resources Department, plays a central role in selecting themes and setting targets for health promotion activities, checking the progress of individual activities, and promoting information disclosure on health management in cooperation with the Health and Safety Committee and industrial physicians. | Established on October,2 2023 |
| Internal Audit Office | 1 | The Internal Audit Office, under the jurisdiction of the Representative Director, prepares an audit plan for each fiscal year and conducts operational audits in accordance with that audit plan. The results are reported to the Representative Director promptly after the audit is conducted. | ― |
Anti-Corruption and Political Contributions
In FY23, there were no cases involving corruption, bribery, discrimination, harassment, conflicts of interest, money laundering, insider trading, or political contributions.In addition, we have no track record of making political contributions.We will continue our efforts to prevent corruption and human rights violations.
GRI Standards
General Disclosures
Economic
Environmental
Social
-
Sustainability
-
E(Environment)
-
S(Social)
-
Contributing to Society through Business
-
Human Capital
-
Regional Co-creation Activities
-
-
G(Governance)
![]()


Copyright © Insource Co., Ltd. All rights reserved.